Your KPIs – All in One Place

Get the top insights you need to make data-driven business decisions quickly.

Advanced Reporting and Dashboard Platform

Wouldn’t it be great if key employees had their own custom reports and dashboards designed specifically for their role?

Role-Based Reporting

Give your team the information they need quickly and succinctly to help them succeed, from the Business Development Rep to the CEO.

Automate Delivery

Eliminate manual processes by scheduling reports to be emailed to your team with real-time data.

Have it Your Way

Choose from eRep Standard Reports or create custom, web-based reports and dashboards with no coding knowledge needed.

From Data to Intelligence

Transform your raw data into actionable intelligence that improves opportunity, quote, and sales channel management with better forecasting, information and insights.
The eRep Reporting dashboard seamlessly integrates desktop and mobile displays featuring graphs, pie charts, statistics, and user messages.
A variety of devices, showcasing eRep products, display a sales management dashboard with charts and data tables on a computer monitor, laptop, tablet, and smartphone.

Why Choose eRep CPQ?

eRep is the complete and affordable sales solution for your internal and external sales channels to dramatically grow sales while helping the entire organization be more efficient, organized and accurate.

eRep can leverage your existing price books, spreadsheets, and ERP data into a complete, modern solution saving time and frustration for everyone from your customers to order entry to the board room.

Data Visualization Studio – How it Works

Create tabular, matrix, and summary reports to highlight your data just the way you need.
Discover the eRep Reporting dashboard interface, showcasing diverse sales reports and charts. View sales by state, project, and manufacturer, all under the BCA Technologies logo prominently placed at the top right.

CREATE YOUR SOURCE REPORTS

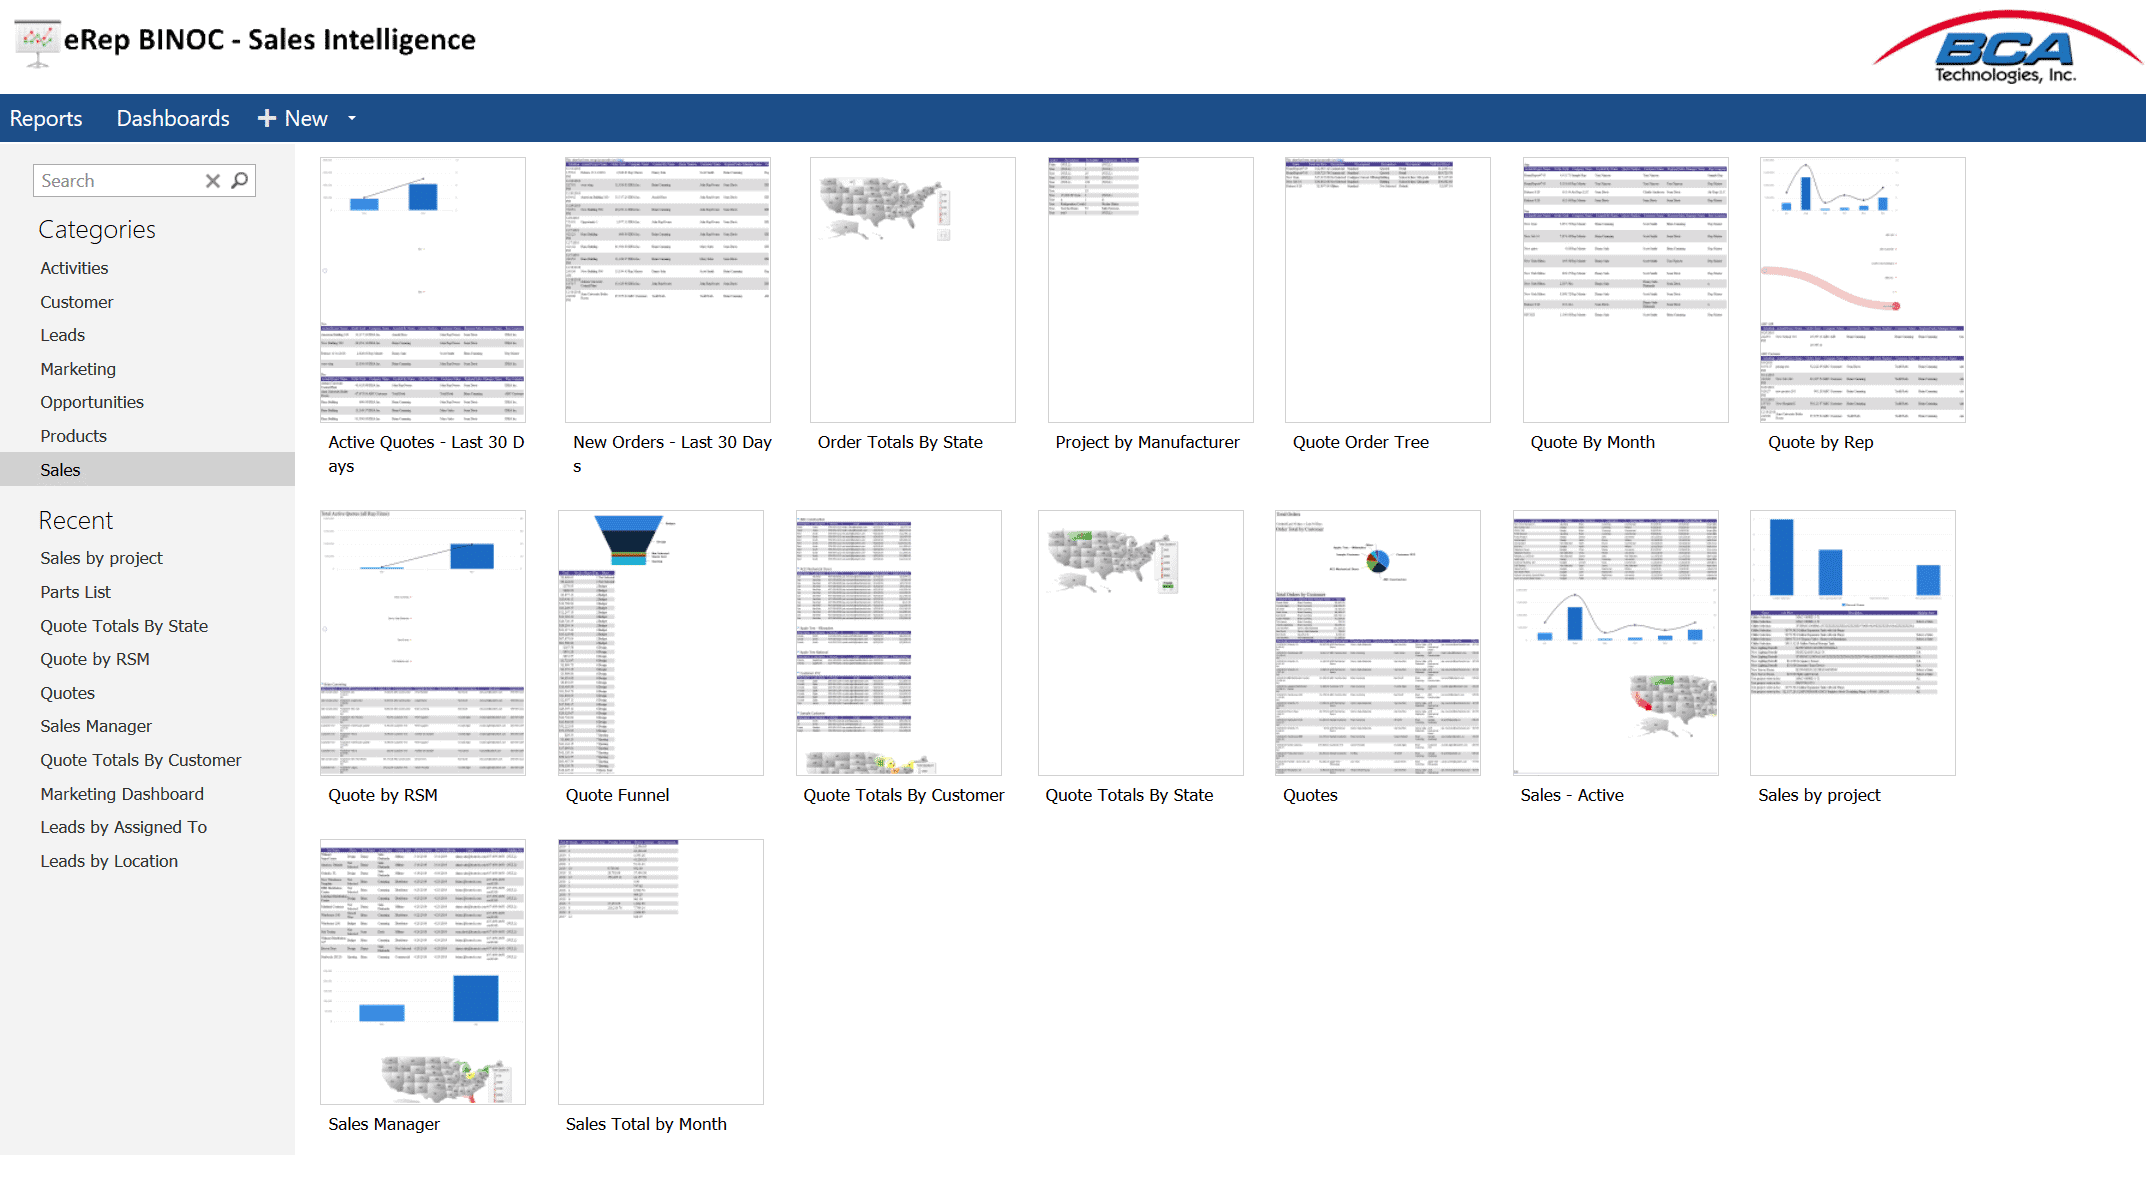
The custom report designer lets users create, modify and save reports and graphs. Once created, you can export to personal or shared dashboards or send the reports to Excel, Word, PDF or XML formats.

Two computer screens showcase eRep Reporting with various data dashboards, charts, and graphs, including a map of North America, pie charts, and line graphs on a website interface.

COMBINE REPORTS AND CHARTS INTO DASHBOARDS

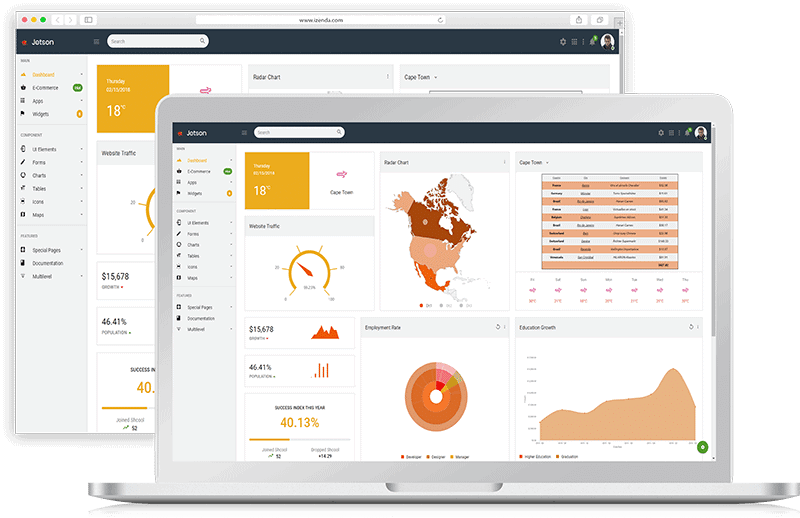
Based on data from your source reports, you can visualize that data and turn it into actionable intelligence with easy-to-understand dashboards customized for each user’s role.

The eRep Reporting dashboard seamlessly integrates desktop and mobile displays featuring graphs, pie charts, statistics, and user messages.

SCHEDULE AUTOMATIC DELIVERY TO TEAM MEMBERS

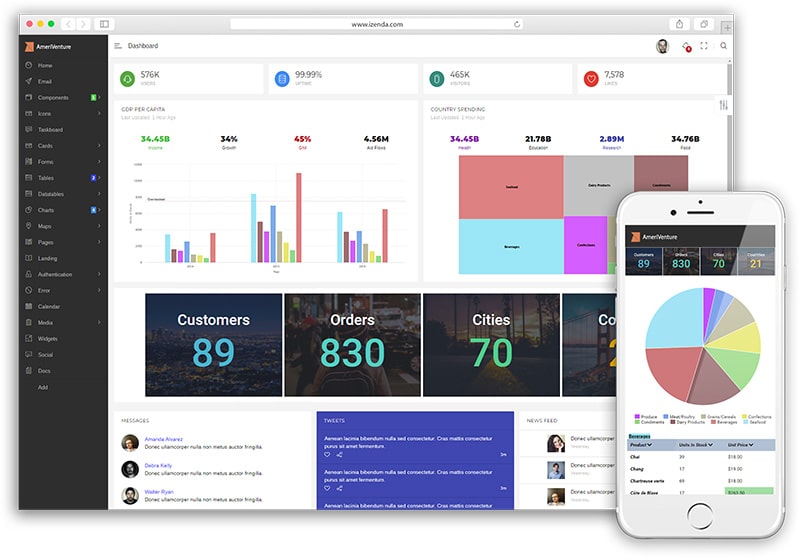
Keep your team up-to-date with real-time data delivered on-demand or through daily, weekly, monthly or quarterly recurring reports. Build your dashboards once and have them roll up across the organizations hierarchy.

Connect With Us

Ready to drive business transformation?